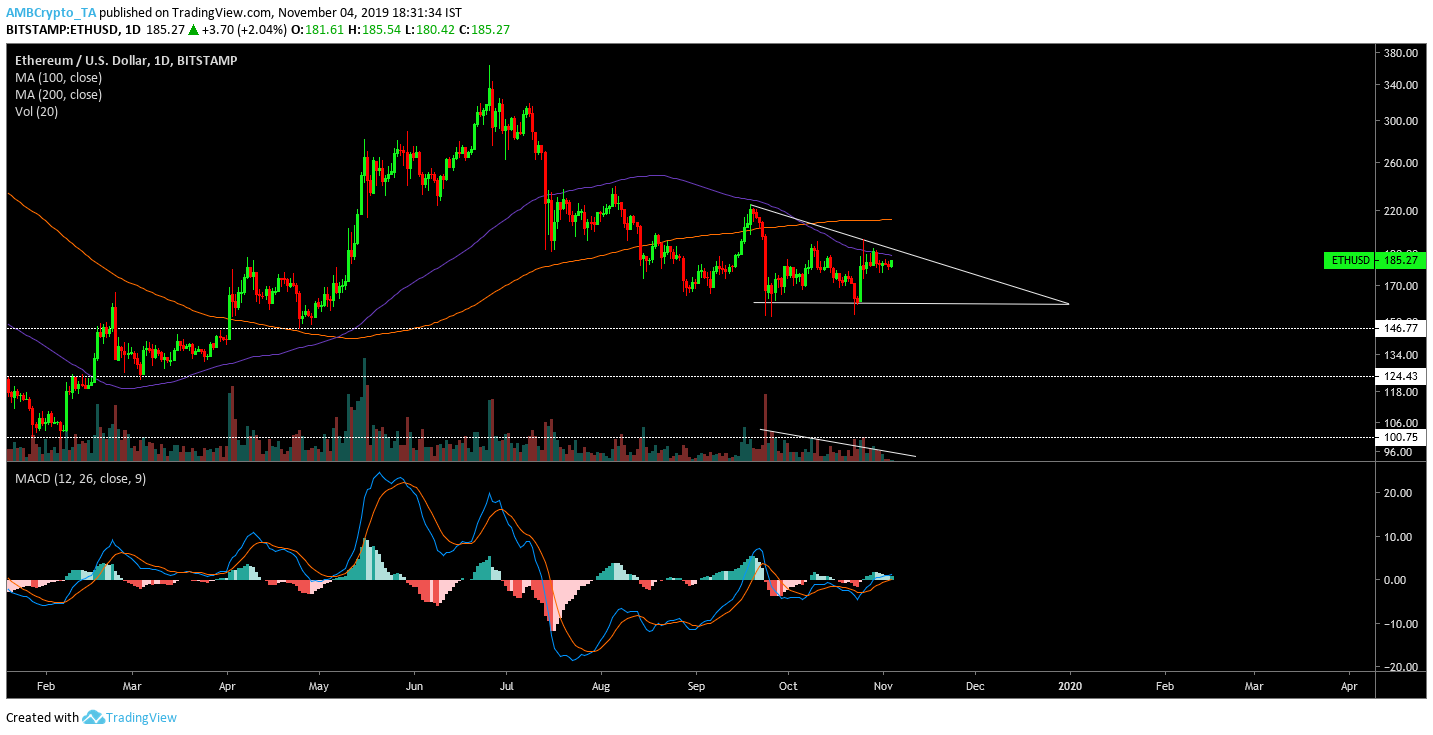
Ethereum recorded a significant rise on 25 October, registering a growth of over 14 percent. However, the 2nd largest crypto-asset has been going through a consolidation phase since. Over the past week, ETH has been moving sideways between the range of $180 and $190 and at press time, its valuation was recorded to be $186.65. 12-hour chart
Source: ETH/USD on Trading View The 12-hour chart for Ethereum pictured a massive hike on 25 October. Since then, however, the token has not undergone any major price swing. However, the price movement for ETH gave rise to a symmetrical triangle pattern, solidifying ETH’s present consolidation period. The possibility of a bullish or bearish breakout was equally divided and the decreasing trade volume suggested that the breakout was imminent. At first glance, in case of a bullish breakout, the immediate resistance would be placed at $191.90 and $202 for Ethereum, whereas the long term support at $163,92 should hold strong, in case of rapid depreciation. The MACD indicator and the Signal line remained in proximity, suggesting that the trend was unclear on the charts. 1-day chart
Source: ETH/USD on Trading View The 1-hour chart for Ethereum provided more clarity as a clear descending triangle was observed. The descending triangle suggested that a bullish pullback was on the cards for the 2nd largest token and major supports were placed at $146.77, $124.43 and $100.75. It was unlikely for ETH to drop down to $100 as market momentum was low, at press time. A major bearish sign was observed between the 100 and 200 Moving Average, as the 200 MA completed a bearish crossover. The decreasing trade volume confirmed the validity of the descending triangle pattern as major traits turned bearish on the charts. The MACD was bullish in the long-term chart for ETH. However, other indicators suggested that a trend reversal would be imminent. —- 编译者/作者:不详 玩币族申明:玩币族作为开放的资讯翻译/分享平台,所提供的所有资讯仅代表作者个人观点,与玩币族平台立场无关,且不构成任何投资理财建议。文章版权归原作者所有。 |
Ethereum's price consolidates; descending triangle projects negative pullback
2019-11-05 不详 来源:区块链网络
LOADING...
相关阅读:
- 富士币圈-07.27多空全部获利2020-07-27
- 昕雨论币:7.24比特币、以太坊行情分析与操作策略、静待盘面再次进入2020-07-24
- BTC上破回踩开多2020-07-21
- 7.21BTC下午行情暴涨多单再次来个大丰收获利150个点2020-07-21
- 紫盈说币:7.20比特币投资者炒币心态文章,送给正在迷茫炒币路的你2020-07-20


